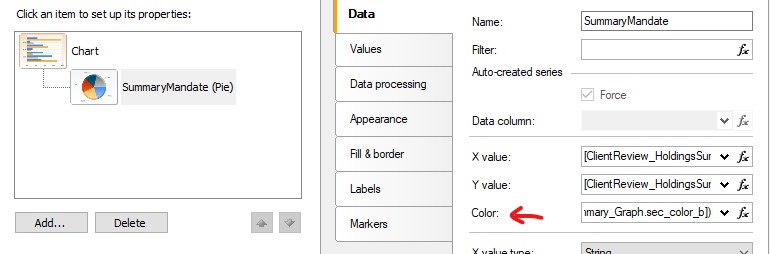
Set Chart Color from data value

I have a as part of the dataset, an RGB color. When I use the designers and set the Color Column to that column it doesn't use the value.
What format should the data be in to use the color column function in the chart
I have a as part of the dataset, an RGB color. When I use the designers and set the Color Column to that column it doesn't use the value.
What format should the data be in to use the color column function in the chart
Comments
Try to convert RGB color to integer
Color = DarkGoldenRod
col1,col2,col3 = 184,134,11
colorint = 12092939
I've tried Color.FromArgb(col1,col2,col3) where col* are integer values for R,G,B. didn't work
I've also tried
Color.FromArgb(colorint)
seccolorint = 12092939
from the frx:
<MSChartSeries Name="Series3" GroupBy="XValue" XValue="[ClientReview_HoldingsSummary_Graph.sec_description]" YValue1="[ClientReview_HoldingsSummary_Graph.totalmarket]" Color="[ClientReview_HoldingsSummary_Graph.sec_color_int]"/>
That parameter is not used when the data is grouped, even if the seccolorint is the same as the grouping