Problem creating charts for data groups

Hi, I'm quite new to FastReport and am having some troubles trying to create a report with charts. The data comes from a list of objects representing readings from a temperature monitoring software that collects data from several points. I'm trying to use the point ID as the grouping criterion to generate the temperature graphs for each point.
I've used a group header to create separate data bands for each point and adding a chart (or sparkline) to each point's respective data band, which worked out so far. But linking the data to the charts either results in the charts being completely empty or every chart containing all of the data.
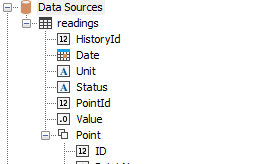
The data I'm using to plot the charts is organized like this:
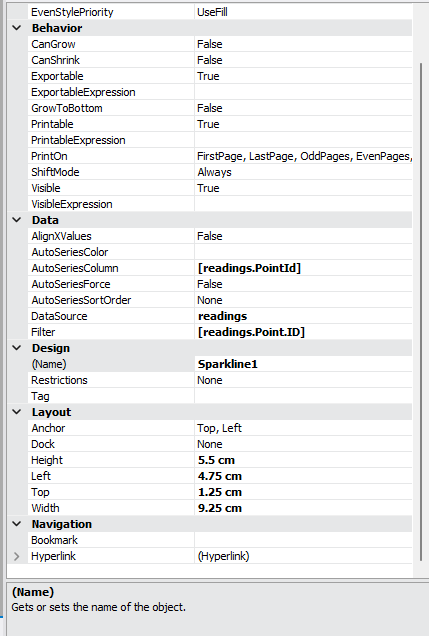
Here is the basic report structure, I have the same problems using either the sparkline or the MS Chart objects.

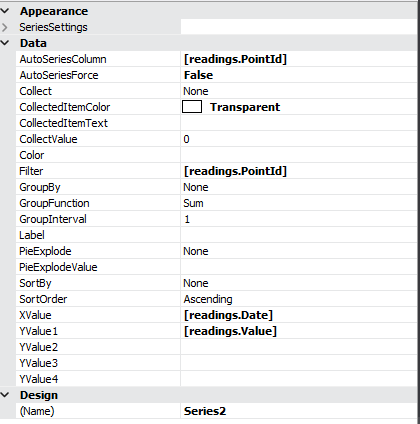
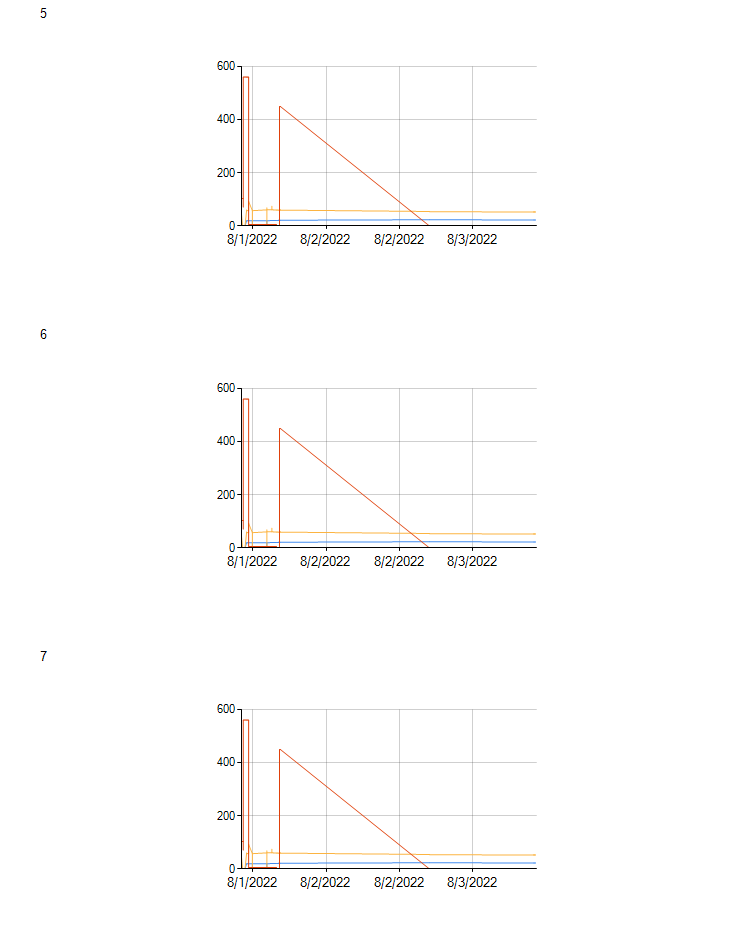
If I dont set the filter property on the series to use the point ID then the chart is actually generated, but containing the data from all the points on every chart. Here 5, 6 and 7 are each point's ID.

I think I have iterated over all possible combinations of (at least to me) relevant property values for either the charts or group bands, if someone could help me it would be highly appreciated. Thanks.