How to enable both Minor and Major Axis in Ticks and Grids of line chart (Spline)?

Hello everyone,
I am working with line chart in Fastreport. My problem is that i can't have both minor and major grids in my line chart. Is there a possibility to have both, while I am missing some labels in X axis.
For ex: If I have months in x axis, I have january ( J) and then comes March(M) (missing February(F) in label and Grid, but it has the y value ). I have minor axis enabled in this case.
If i enable major axis, then i will have February(F), but will miss january (J) and march(M).
Inputting Data in this way:
MSChart1.Series[0].SeriesSettings.Points.AddXY(labels[i], data[i]);
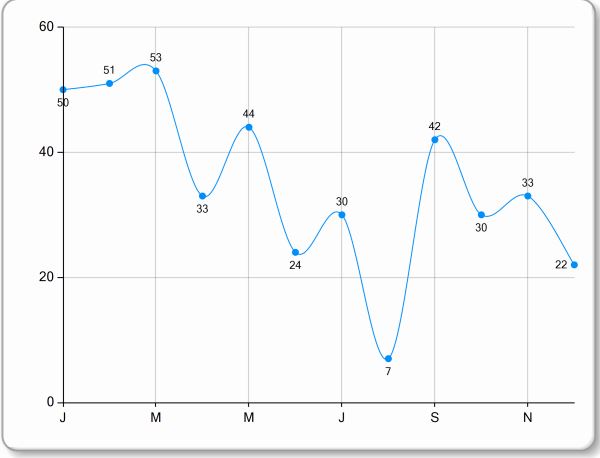
Reference Image:
How can i fix this?