Multi Page Charts
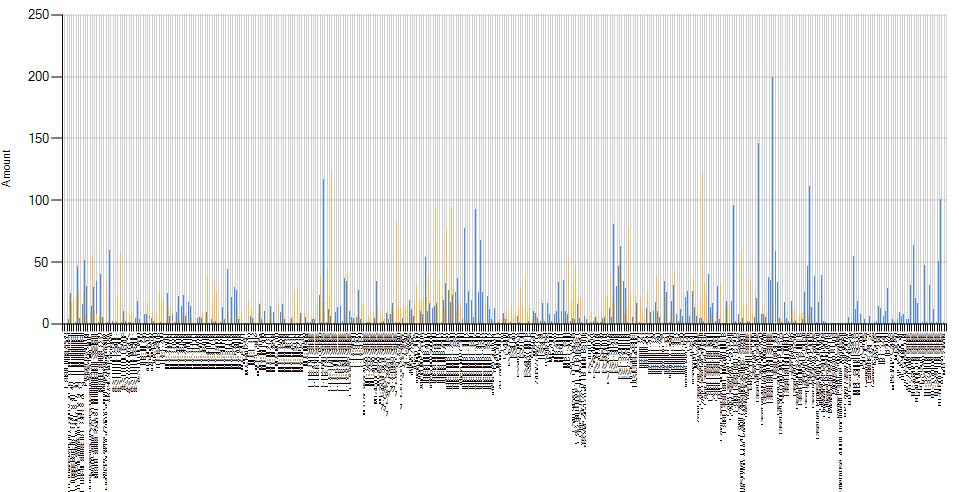
I am generating a bar chart with data from an SQL Database and when data is selected from a moderate to large date range it causes a very large amount of bar columns to be required. I am using auto generated series, and end users can select the date range to chart.
Due to the amount of columns the labels for these columns get scaled down to an unreadable size. To resolve this I would like to extend the chart to multiple pages when more than a certain amount of columns are present, as this would resolve the issue I am having and also leave the rest of the chart scaled to an amount reasonable to be printed and examined.
Extending to multiple pages is very straight forward with bands but how can I accomplish this with charts?

I have also attempted splitting the data up into smaller groups (less desirable to me) using databands but this produces the same chart on each band, unlike textual reports.
Due to the amount of columns the labels for these columns get scaled down to an unreadable size. To resolve this I would like to extend the chart to multiple pages when more than a certain amount of columns are present, as this would resolve the issue I am having and also leave the rest of the chart scaled to an amount reasonable to be printed and examined.
Extending to multiple pages is very straight forward with bands but how can I accomplish this with charts?

I have also attempted splitting the data up into smaller groups (less desirable to me) using databands but this produces the same chart on each band, unlike textual reports.