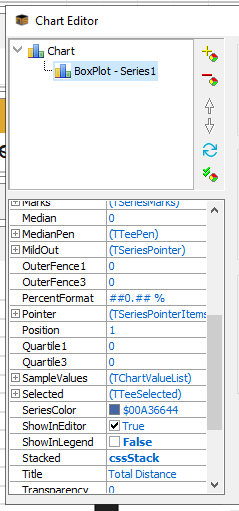
For Box Plot series in the Steema TeeChart VCL library, the Quartile1 and Quartile3 parameters are responsible for the lower and upper boundaries of the “box” in a box plot. They represent the first (25th percentile) and third (75th percentile) quartiles of the data sample.
📊 What these parameters mean
Quartile1 (Q1): This is the first quartile, or the 25th percentile. It shows the value below which approximately 25% of all data points in the sample fall.
Quartile3 (Q3): This is the third quartile, or the 75th percentile. It shows the value below which approximately 75% of all data points fall (that is, only 25% of values are above it).
In a box plot, these two values form the lower and upper boundaries of the rectangular “box.” A line corresponding to the median (the second quartile, or 50th percentile) is usually drawn inside this “box.”
⚙️ How this works in TeeChart
By default, these values are calculated automatically based on the data array added to the series. The TeeChart algorithm finds the median, Quartile1, and Quartile3, and then builds the “box” based on them.
However, you can override these values manually. To do this, you need to:
Set the UseCustomValues = True property for the Box Plot series.
Assign the desired values to the Quartile1 and Quartile3 properties (and, if necessary, to other parameters such as Median, InnerFence1, InnerFence3, etc.).
This allows you to build the chart using precomputed statistical values without having to provide the full array of source data.
💎 Brief summary
Quartile1 is the lower boundary of the “box” (25th percentile).
Quartile3 is the upper boundary of the “box” (75th percentile).
Together they define the interquartile range (IQR), which is the basis for constructing a box plot in TeeChart.

Comments
Answer from DeepSeek:
For Box Plot series in the Steema TeeChart VCL library, the
Quartile1andQuartile3parameters are responsible for the lower and upper boundaries of the “box” in a box plot. They represent the first (25th percentile) and third (75th percentile) quartiles of the data sample.📊 What these parameters mean
In a box plot, these two values form the lower and upper boundaries of the rectangular “box.” A line corresponding to the median (the second quartile, or 50th percentile) is usually drawn inside this “box.”
⚙️ How this works in TeeChart
By default, these values are calculated automatically based on the data array added to the series. The TeeChart algorithm finds the median,
Quartile1, andQuartile3, and then builds the “box” based on them.However, you can override these values manually. To do this, you need to:
UseCustomValues = Trueproperty for the Box Plot series.Quartile1andQuartile3properties (and, if necessary, to other parameters such asMedian,InnerFence1,InnerFence3, etc.).This allows you to build the chart using precomputed statistical values without having to provide the full array of source data.
💎 Brief summary