X Axis Labels vs Bar Value Label

Hello,
I am looking to have a different label along the X axis of a bar chart vs the bar's value label at the top. I can't seem to figure out the right combination of settings.
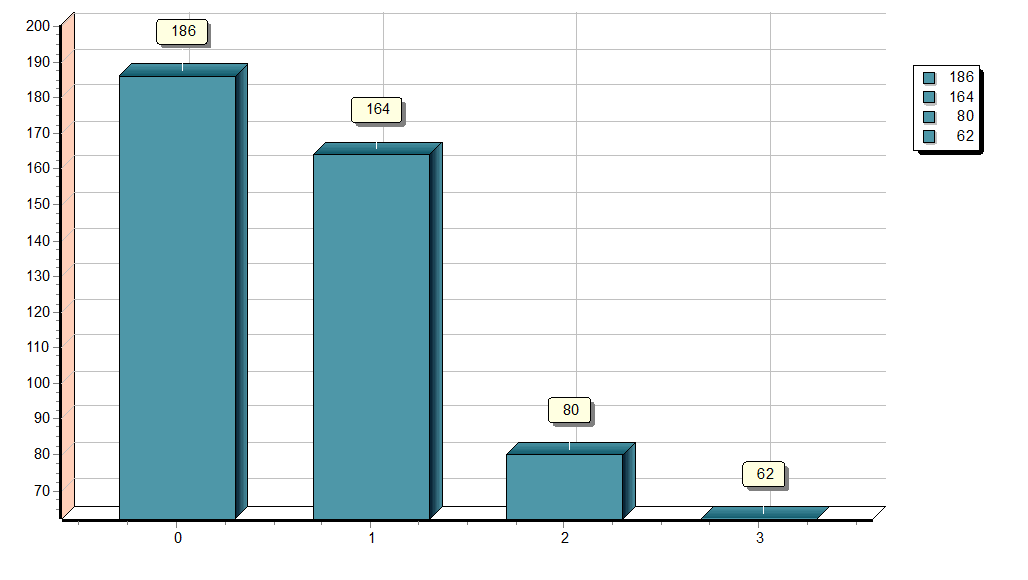
This first chart is with a single Bar on a Chart with a Dataset Datasource, Values | Y set to the numbers column and the Values | X (optional) set to what I want the X axis label to be. The X (optional) is ignored as far as I can tell.
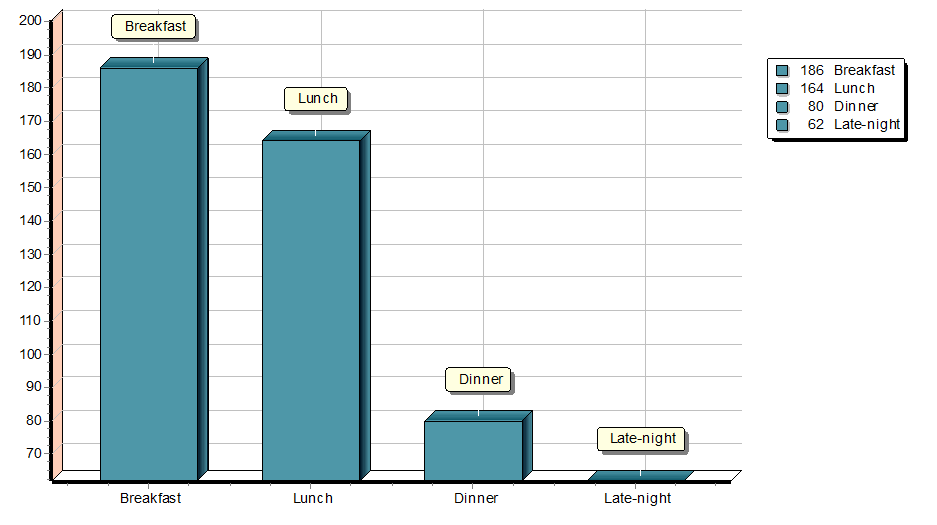
This second chart is a single Bar on a Chart with the same Dataset Datasource, Values | Y set to the numbers column and the Values | Label set to what I want the X axis label to be. It overrides the value label at the top of the bar and repeats it at the bottom.
I'm looking for the following:
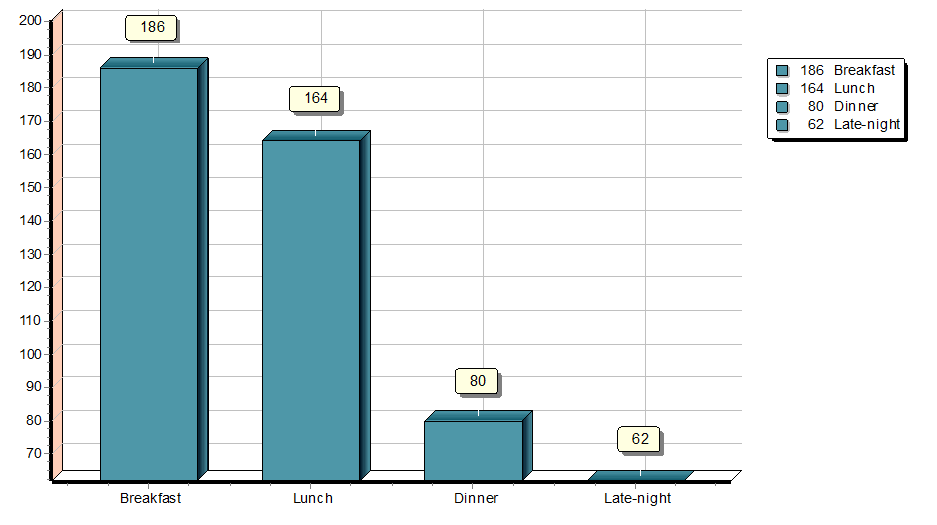
I am happy to perform this in code, but I simply don't know the FR5 VCL at all.
Thank you for any and all direction you can provide.
Regards, John
Comments
Hello!
You need to set Marks.Style := smsValue for the Series
Best regards